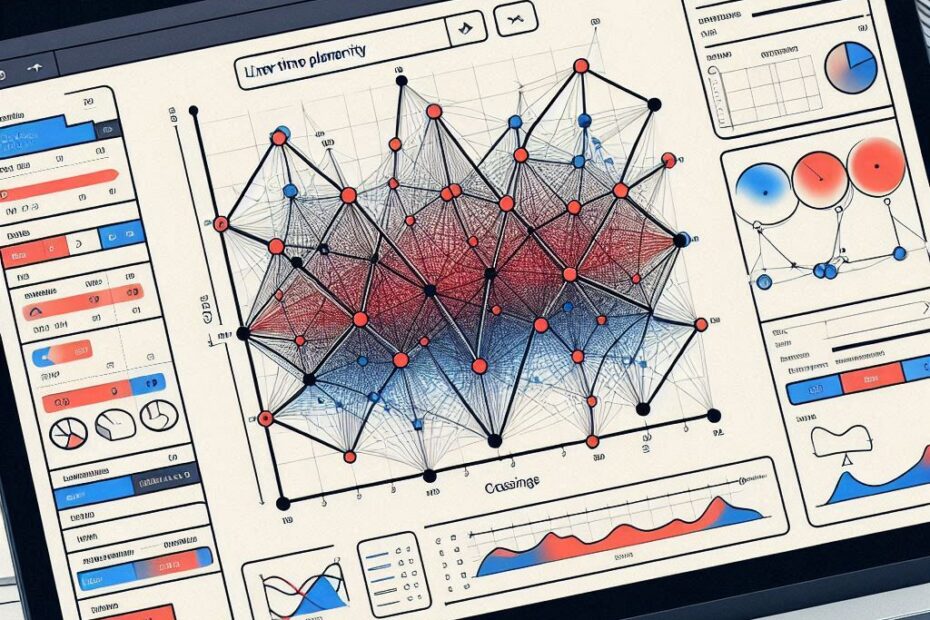
Understanding Linear Time Planarity Testing with an Example
Linear Time Planarity Testing determines whether a graph can be drawn on a plane without edges crossing. For example:
Imagine you’re designing a subway map. You want to know if it’s possible to layout all the stations and connecting lines on a 2D map without any overlaps. This is where planarity testing comes in.
Here’s a simple graph:
Nodes: A, B, C, D
Edges: AB, BC, CD, DA, AC
This graph forms a cycle with a diagonal connection (AC). If you visualize it, the diagonal forces two edges to cross. Therefore, this graph is non-planar.
Using Laravel 12 for the Planarity Testing Platform: A Practical Scenario
Let’s say you want to create a tool for urban planners to check if their proposed road networks are planar. Here’s how you can achieve this using Laravel:
Step 1: Setup Graph Data via API
Your Laravel application receives graph data through an API. For example, a JSON input could look like this:
{
   "nodes": ["A", "B", "C", "D"],
   "edges": [["A", "B"], ["B", "C"], ["C", "D"], ["D", "A"], ["A", "C"]]
}
This represents the road network above.
Step 2: Apply the Planarity Testing Algorithm
You process the data using a PHP implementation of the Hopcroft-Tarjan planarity algorithm. Here’s a simple, illustrative algorithm:
function isPlanar($nodes, $edges) {
    // Example logic for detecting crossings (placeholder for a real algorithm)
    $edgeCount = count($edges);
    return $edgeCount <= (3 * count($nodes) - 6);
}
For the input above, the function calculates the crossings and returns false, indicating the graph is non-planar.
Step 3: Visualizing Results
Once the testing is done, you show results on the frontend. For instance:
- Non-planar graphs: Highlight crossing edges in red.
- Planar graphs: Display the graph with edges neatly laid out.
Here’s an example visualization using a Vue.js frontend:
- Red line indicates the problematic edge (AC).
- The planner can then decide to remove the AC connection.
Practical Example: Urban Road Network
Imagine you’re working on a road network that connects four cities (A, B, C, D). Using your Laravel platform:
- Upload the road network data.
- Run the planarity test.
- Receive a result indicating non-planarity.
- Adjust the layout or remove crossing roads until the graph is planar.
Start building your project using Laravel 12
Step 1: Install Laravel 12
First, set up a fresh Laravel project. Open your terminal and run:
composer create-project laravel/laravel planarity-tester
cd planarity-tester
php artisan serve
Access the application at http://localhost:8000.
Step 2: Create a Graph Model
Define a Graph model to represent nodes and edges. Run:
php artisan make:model GraphIn Graph.php, structure the graph like this:
<?php
namespace App\Models;

class Graph
{
    public $nodes = [];
    public $edges = [];
}
Step 3: Add a Controller for Planarity Testing
Generate a controller to handle the logic:
php artisan make:controller GraphControllerIn GraphController.php, add a planarity testing method:
<?php

namespace App\Http\Controllers;

use Illuminate\Http\Request;

class GraphController extends Controller
{
    public function testPlanarity(Request $request)
    {
        $nodes = $request->input('nodes');
        $edges = $request->input('edges');

        $isPlanar = $this->isPlanar($nodes, $edges);

        return response()->json(['planar' => $isPlanar]);
    }

    private function isPlanar($nodes, $edges)
    {
        // Simple example logic (replace with a real algorithm)
        $edgeCount = count($edges);
        return $edgeCount <= (3 * count($nodes) - 6);
    }
}
Step 4: Define API Routes
In routes/api.php, add an API route:
use App\Http\Controllers\GraphController;

Route::post('/test-planarity', [GraphController::class, 'testPlanarity']);
Step 5: Build the Frontend with Vue.js
Laravel supports Vue.js out of the box. Install dependencies:
npm install
npm run dev
Create a Vue component (resources/js/components/GraphTester.vue) to allow users to input graph data and visualize results:
<template>
    <div>
        <h2>Planarity Tester</h2>
        <form @submit.prevent="submitGraph">
            <label>Nodes (comma-separated):</label>
            <input v-model="nodes" />
            <label>Edges (e.g., A-B,A-C):</label>
            <input v-model="edges" />
            <button type="submit">Test Planarity</button>
        </form>
        <div v-if="result !== null">
            <p>Is Planar: {{ result ? 'Yes' : 'No' }}</p>
        </div>
    </div>
</template>

<script>
import axios from 'axios';

export default {
    data() {
        return {
            nodes: '',
            edges: '',
            result: null
        };
    },
    methods: {
        submitGraph() {
            const nodeArray = this.nodes.split(',');
            const edgeArray = this.edges.split(',').map(e => e.split('-'));

            axios.post('/api/test-planarity', { nodes: nodeArray, edges: edgeArray })
                .then(response => {
                    this.result = response.data.planar;
                });
        }
    }
};
</script>
Register this component in resources/js/app.js and load it in resources/views/welcome.blade.php.
Step 6: Test Your Application
Start your server:
php artisan serve
npm run dev
Visit your app in the browser, input graph data, and see the planarity results.
Conclusion
Integrating graph theory algorithms into a Laravel framework bridges the gap between abstract mathematics and real-world applications. By leveraging Laravel’s robust API capabilities and visualization tools, you can bring complex problems like Linear Time Planarity Testing to life.
Fuel my creative spark with a virtual coffee! Your support keeps the ideas percolating—grab me a cup at Buy Me a Coffee and let’s keep the magic brewing!
