“Your site is down.” — a user message. By the time you SSH in, the damage is done.
Every Laravel developer has lived this moment. The app slows down, queues back up, jobs retry silently, and users experience degraded service — all before a single alert fires. By the time you’re staring at logs, you’re already in firefighting mode.
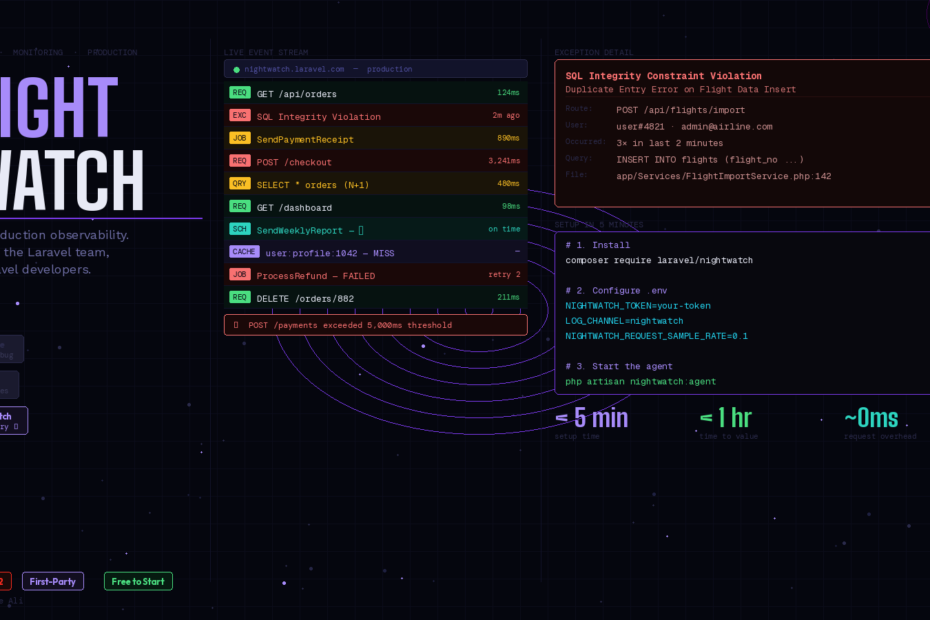
Laravel Nightwatch changes that. Announced at Laracon EU 2025 alongside Laravel 12, it’s the first official, first-party production monitoring platform built from the ground up for Laravel — not bolted on, not adapted from a generic APM tool. It thinks like a Laravel developer because it was built by one.
Here’s everything you need to know to get started today.
Telescope vs Pulse vs Nightwatch — Which One Do You Need?
Before diving into Nightwatch, let’s kill the confusion once and for all. These three tools serve different purposes:
Laravel Telescope is a local development debugger. It shows you every request, query, job, mail, and notification in granular detail. It’s indispensable during development — and a performance liability in production. Never run Telescope in production.
Laravel Pulse is a lightweight production dashboard for aggregated metrics. It shows you CPU usage, queue throughput, slow queries, and cache hit rates at a high level. Think of it as a health dashboard — great for a quick overview, but it doesn’t give you the full story of an individual request or error.
Laravel Nightwatch is full production observability. It connects the dots between requests, jobs, queries, exceptions, and user sessions to show you exactly what happened, in what order, and why. When an error fires, Nightwatch tells you the route, the user, the stack trace, the related queries, and the full request context — in real time.
The official Laravel framing captures it perfectly: Telescope helps you debug locally. Pulse shows you aggregated metrics. Nightwatch gives you the full story of what’s happening in production.
What Nightwatch Monitors
Nightwatch hooks into Laravel’s event system and request lifecycle to collect data across every layer of your app. Out of the box, with zero configuration, it tracks:
- Requests — every HTTP request with timing, route, status code, and user context
- Exceptions — handled and unhandled errors with full stack traces and affected users
- Database queries — slow queries, N+1 detection, and query frequency analysis
- Jobs & queues — execution time, retries, failures, and queue depth
- Scheduled tasks — whether your scheduler is running on time and tasks complete successfully
- Cache — key hit rates, storage patterns, and invalidation events
- Outgoing HTTP requests — external API calls with response times
- Mail & notifications — delivery tracking
Each of these is what Nightwatch calls an “event.” Pricing is event-based, giving you fine-grained control over what you track and how much you spend.
Setup: Under 5 Minutes
This is genuinely one of the fastest setups in the Laravel ecosystem. Three commands and two config lines:
Step 1: Install the package
composer require laravel/nightwatch
Step 2: Register and get your token
Head to nightwatch.laravel.com, create an account, create a project, and copy your environment token.
Step 3: Configure your environment
NIGHTWATCH_TOKEN=your-token-here
LOG_CHANNEL=nightwatch
NIGHTWATCH_REQUEST_SAMPLE_RATE=0.1
The NIGHTWATCH_REQUEST_SAMPLE_RATE is important. Setting it to 0.1 means Nightwatch samples 10% of requests — enough to get accurate insights while keeping your event quota in check. For high-traffic endpoints you care about most, you can increase sampling selectively.
Step 4: Start the agent
Nightwatch runs a lightweight sidecar agent that buffers events locally and sends them to Nightwatch’s servers every 10 seconds (or when 8MB accumulates):
php artisan nightwatch:agent
In production, run this with a process monitor. If you’re on Laravel Forge, it’s a one-click daemon. On Laravel Vapor, it runs automatically. For Docker, add it to your entrypoint:
# In your container's start script
php artisan nightwatch:agent &
php artisan serve
Verify the agent is healthy:
php artisan nightwatch:status
That’s it. Nightwatch starts collecting data immediately — no instrumentation, no code changes, no extra configuration.
The Features Worth Knowing
Real-Time Exception Tracking
When an exception fires in production, Nightwatch surfaces it immediately with:
- The exact route and controller method
- The full stack trace with line numbers
- Which users were affected and how many times
- The complete request context (headers, payload, session data)
- Related database queries that ran before the error
This is the difference between “we have an error on /payments” and “this specific user triggered this specific exception because this query returned null.”
Custom Performance Thresholds
Define what “slow” means for your app, not Nightwatch’s defaults:
// In your AppServiceProvider or a dedicated provider
use Laravel\Nightwatch\Facades\Nightwatch;

Nightwatch::threshold('slow-query', seconds: 0.5);
Nightwatch::threshold('slow-request', seconds: 2.0);
Nightwatch::threshold('slow-job', seconds: 30);
The moment any metric exceeds your threshold, Nightwatch fires an alert. You can route alerts to Slack, email, or any webhook — the same moment the issue occurs, not after a user reports it.
User-Level Request Tracing
One of Nightwatch’s most powerful features is the ability to trace the full experience of a specific user. When a support ticket comes in from a customer, you can pull up their session in Nightwatch and see every request they made, every error they hit, and every slow query that affected them — in chronological order.
// Nightwatch picks up Auth::user() automatically
// But you can add custom user context for unauthenticated flows:
use Laravel\Nightwatch\Facades\Nightwatch;

Nightwatch::user([
    'id'    => $guestSession->id,
    'name'  => 'Guest',
    'email' => $guestSession->email ?? null,
]);
Queue & Job Monitoring
Nightwatch gives you visibility into your queue that Horizon alone can’t provide — because it connects job execution to the request that dispatched it. You can see that a payment notification job was dispatched from POST /checkout, took 4.2 seconds, retried twice, and finally succeeded on the third attempt.
The Architecture Under the Hood
Nightwatch is engineered for scale. Under the hood it uses Amazon MSK (Managed Streaming for Apache Kafka) combined with ClickHouse Cloud for its data storage — a column-oriented architecture that keeps queries fast even as your event volume grows into the billions.
The agent batches data locally before sending it, which means it adds essentially zero overhead to your request cycle. The performance impact is negligible even on high-traffic apps.
Nightwatch vs New Relic vs Sentry
Why use Nightwatch instead of the established players?
New Relic and Datadog are powerful but generic. They understand HTTP and databases, but they don’t understand Eloquent relationships, Laravel queues, Blade rendering, or the request lifecycle of a Laravel app. You get raw data without framework context. Configuration is heavy. Cost scales aggressively.
Sentry is excellent for exception tracking specifically — but it’s not a full APM. It won’t tell you about slow queries, queue depth, cache miss rates, or scheduler health.
Nightwatch understands your app the way you do. It knows what a failed job means in relation to the request that dispatched it. It knows what a slow query means in relation to the Eloquent model it came from. It requires zero instrumentation because it’s built into the same framework you’re already using. And it’s priced for Laravel developers — not enterprise SaaS budgets.
What to Watch in Production From Day One
Once Nightwatch is running, here are the five things to set up alerts for immediately:
- Any exception rate spike — more than X exceptions in Y minutes on any route
- Slow requests — any route averaging over 2 seconds
- Job failures — any job class failing more than twice consecutively
- Scheduler misses — your scheduler not running within its expected window
- Slow queries — any query taking over 500ms
These five alerts will catch 90% of production issues before your users notice them.
Should You Use Nightwatch Today?
If you’re running any Laravel app in production that handles real users and real data — yes, without hesitation.
Nightwatch is free to start and you can set a spending cap so you never get a surprise bill. For small apps with low traffic, you may stay on the free tier indefinitely. For SaaS apps processing thousands of requests per hour, the event-based pricing is still dramatically cheaper than New Relic or Datadog.
The setup takes five minutes. The value shows up within the hour — Geocodio’s CTO said they were catching issues they didn’t know existed within 60 minutes of deployment.
That’s the benchmark. Five minutes of setup. One hour to value. Start tonight.
Follow me for daily deep-dives on Laravel, PHP, Vue.js, and AI integrations. New article every day.