Nightwatch MCP dropped February 17th. Here’s what it actually does, how to set it up in three steps, and the exact prompts that turn Claude Code into a production debugging partner.
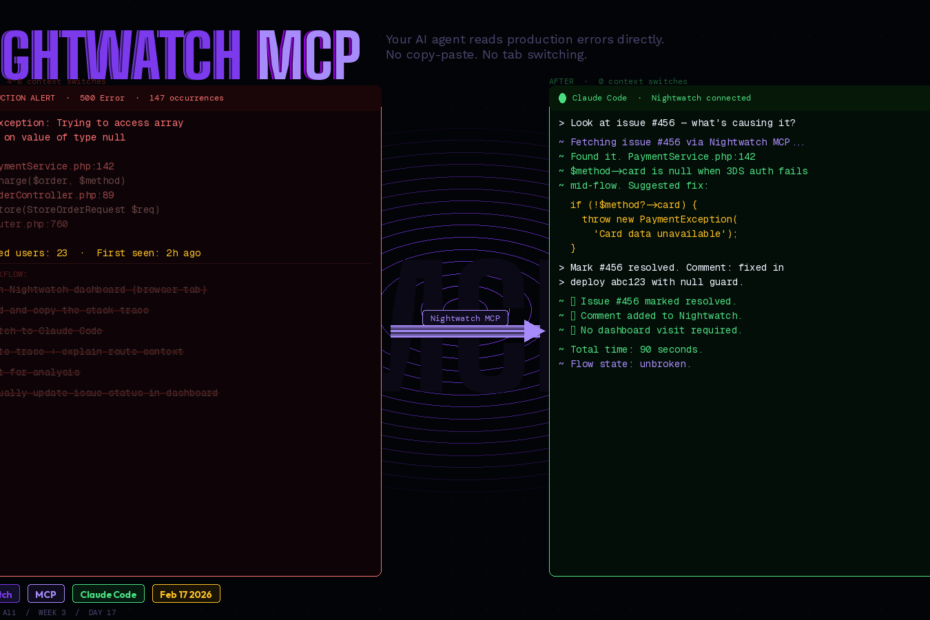
Picture the moment: you’re in a flow state, deep in a feature. Slack pings. A 500 error, in production. You open Nightwatch, find the stack trace, copy it, switch to Claude Code, paste it in, add context, explain what the route does, and wait.
That’s four context switches and two minutes of mechanical work before you’ve even started debugging.
Nightwatch MCP eliminates all of it. Your AI agent already knows what broke.
What Nightwatch MCP Actually Is
Nightwatch MCP is a Model Context Protocol server that integrates with your Laravel Nightwatch monitoring account. It exposes your application’s production context — exceptions, stack traces, issue statuses, request history — directly to any MCP-compatible AI agent.
The practical result: instead of copying errors to your AI tool, your AI tool reads them directly. No copy-pasting. No tab switching. Just ask, and your AI already knows what’s happening in production.
The MCP server lets your agent do five specific things:
- List applications — see all your Nightwatch-monitored apps
- Browse issues — list exceptions and performance issues with occurrence counts
- View stack traces — full stack trace with code context, not just the error message
- Update issue status — mark issues as resolved, ignored, or triaged
- Add comments — document findings and workarounds without leaving your editor
This isn’t an AI that helps you debug hypothetically. It’s an AI that reads your actual production errors and reasons about your actual codebase simultaneously.
What Is Nightwatch (If You’re Not Using It Yet)
Before the MCP setup, a quick orientation. Nightwatch is Laravel’s first-class production monitoring product — purpose-built for Laravel, not a generic PHP adapter bolted onto an APM tool.
Where Telescope helps you debug locally and Pulse shows aggregated metrics, Nightwatch gives you the full production story: every request, job, query, exception, notification, scheduled command, and outgoing HTTP call — linked together so you can trace a user’s experience from first request to failed queue job.
The MCP server is a layer on top of that. Nightwatch collects the data; the MCP server makes that data conversationally accessible to your AI agent.
Setup: Three Steps
Step 1: Install Nightwatch (If Not Already)
composer require laravel/nightwatch
php artisan nightwatch:install
Add your token to .env:
NIGHTWATCH_TOKEN=your_token_here
If you’re using Laravel Boost, Nightwatch MCP can be configured automatically during installation — Boost detects the laravel/nightwatch package and offers to set up the MCP server for you. Skip to Step 3 if that’s your setup.
Step 2: Add the MCP Server to Your AI Agent
For Claude Code — add to ~/.config/claude/claude_desktop_config.json or your project’s .mcp.json:
{
  "mcpServers": {
    "nightwatch": {
      "command": "npx",
      "args": ["-y", "mcp-remote", "https://nightwatch.laravel.com/mcp"]
    }
  }
}
For OpenCode:
opencode mcp add
# Select "remote" when prompted
# Enter: https://nightwatch.laravel.com/mcp
For any other MCP-compatible client — the server URL is:
https://nightwatch.laravel.com/mcp
Step 3: Authenticate
In a Claude Code session, run:
/mcp
This triggers the OAuth flow. A browser window opens, you authorise Claude Code to access your Nightwatch account, and the token is stored locally. You authenticate once — it persists across sessions.
Nightwatch uses OAuth to securely connect AI assistants to your account. Your production data never passes through Anthropic’s servers — the MCP server handles the connection directly between your AI client and the Nightwatch API.
That’s it. Three steps. Your agent is now connected to your production monitoring.
The Debugging Workflow in Practice
Scenario 1: Investigating a Specific Issue
You see an error number in Slack or a Nightwatch alert. Paste it directly:
Can you look at issue #456 and tell me what's causing it?
Claude Code calls the Nightwatch MCP to retrieve the full stack trace, occurrence history, and code context. It reads the stack trace in the context of your actual codebase (because Claude Code already has your files open) and gives you an analysis: what caused it, which line is the likely culprit, and what the fix is.
No copy-pasting the stack trace. No explaining what the route does. The agent already has everything.
You can also paste issue URLs directly from Nightwatch:
https://nightwatch.laravel.com/apps/my-saas/issues/456

What's causing this and how do I fix it?
Scenario 2: Prioritising the Issue Backlog
Monday morning, you have 12 unresolved issues. Ask:
What are the most recent exceptions in my production environment?
Help me prioritise which ones to fix first.
The agent retrieves all open issues with their occurrence counts, affected user counts, and recency data. It surfaces the ones with the highest user impact — not just the ones that appeared most recently — and gives you a prioritised list with reasoning.
This turns what used to be 20 minutes of dashboard review into a 30-second conversation.
Scenario 3: Multi-App Triage
If you have multiple Nightwatch applications:
What's the error rate looking like across all my apps today?
Is anything unusual happening in the payments service?
The agent lists your applications, queries issues across them, and gives you a cross-app health summary. Reference apps by name — "issue #456 in Beep" — and the MCP server routes the query to the right application automatically.
Scenario 4: Closing the Loop
Once you’ve fixed an issue and deployed:
Mark issue #456 as resolved and add a comment:
"Fixed in deploy abc123 — null check added to PaymentService::charge()"
The agent calls the Nightwatch MCP to update the issue status and add the comment — all without leaving your terminal or editor. Your issue tracker stays current without a separate browser tab.
What the MCP Server Exposes (And What It Doesn’t)
What the agent can access:
- Your list of Nightwatch-monitored applications
- All open, resolved, and ignored issues
- Full stack traces with line numbers and context
- Occurrence counts and frequency data
- Issue metadata: first seen, last seen, affected user count
- Issue status (open / resolved / ignored)
- Issue comments
What the agent cannot access:
- Individual request payloads or user data
- Database query contents
- Environment variables or secrets
- Anything outside Nightwatch’s monitoring scope
The OAuth model means you authorise exactly what the agent can see — and that scope is Nightwatch’s issue data, not your raw application internals. This is the right security posture for a production debugging tool.
Nightwatch MCP vs Manual Debugging
Here’s the honest before/after for a typical production bug investigation:
| Step | Without MCP | With Nightwatch MCP |
|---|---|---|
| Find the error | Open Nightwatch dashboard | Already in agent context |
| Get the stack trace | Copy from browser | Agent reads directly |
| Provide codebase context | Paste relevant files manually | Agent already has files open |
| Cross-reference with code | Manual tab switching | Agent reasons across both |
| Document finding | Write Nightwatch comment separately | Agent updates issue directly |
| Mark resolved | Click in dashboard | Agent marks via MCP |
| Total context switches | 4-6 | 0 |
The real saving is not the time per incident — it’s the cognitive load. Context switches kill flow state. Nightwatch MCP means you stay in your editor from “what broke” to “it’s fixed.”
The Linear Integration (Bonus)
The February 16th release also shipped a Linear integration. Connect your Linear workspace from your Nightwatch organisation settings, map Nightwatch applications to Linear teams, and new exceptions automatically create Linear issues routed to the right team.
Combined with the MCP server, the workflow becomes:
- Exception fires → Linear issue auto-created (Nightwatch → Linear)
- Developer asks agent about the issue (Claude Code → Nightwatch MCP)
- Agent investigates and suggests fix
- Developer ships the fix, agent marks Nightwatch issue resolved
Zero manual triage. Zero copy-pasting between tools. The issue flows from production error to fix without leaving your workflow.
Is This Worth Setting Up Right Now?
Yes — if you’re already using Nightwatch. The setup is three steps and five minutes. The payoff is immediate on your next production incident.
If you’re not using Nightwatch yet: the MCP integration is a strong argument to start. Production monitoring has always been valuable. Production monitoring that your AI agent can query conversationally is a qualitatively different proposition.
The combination of Nightwatch (production data) + MCP (agent access) + Claude Code (codebase context) is the closest thing to having a senior developer permanently watching your production environment and available to debug instantly.
Follow me for daily deep-dives on Laravel, PHP, Vue.js, and AI integrations. New article every day.