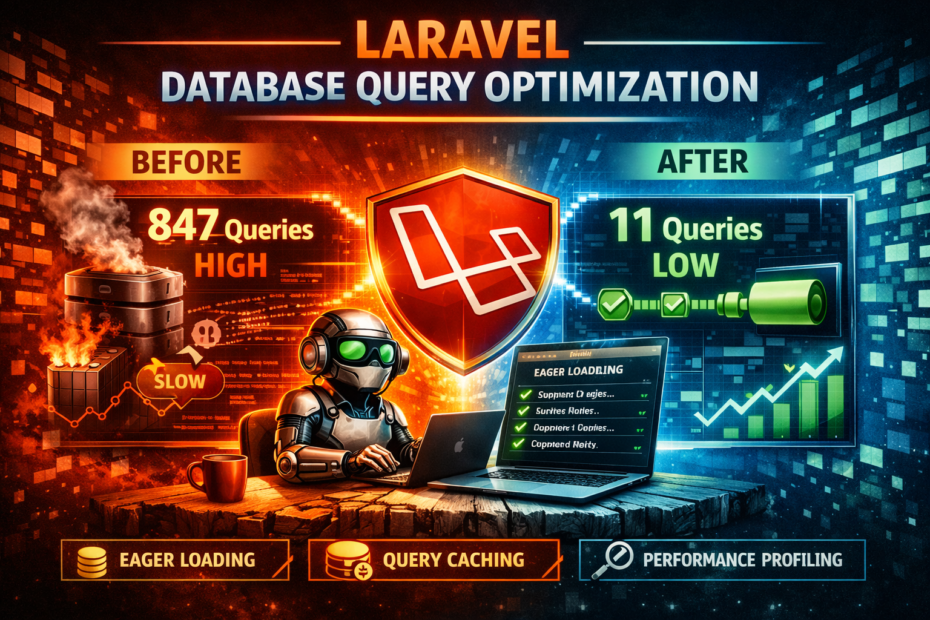
A real audit of a real page: every query logged, every relationship traced, every redundant call eliminated. The exact tools, the exact fixes, and the before/after numbers that made the team go silent in the code review.
The number came from Laravel Debugbar. 847 queries. 3.2 seconds. One page load. The page was a project dashboard — a summary view showing active projects, their latest tasks, assigned team members, and a few aggregated metrics. It didn’t look slow in development. Development had 12 projects and 40 tasks. Production had 380 projects and 14,000 tasks. The 847 number showed up in production logs, traced through a Debugbar session on a production-sized dataset seeded locally.
The end state: 11 queries. 140ms. Same page. Same data. No caching, no denormalization, no infrastructure changes.
This is the exact audit.
The Setup: Seeing What’s Actually Happening
You can’t fix what you can’t see. The first step was making every query visible before touching a line of code.
composer require barryvdh/laravel-debugbar --dev
Debugbar in local with a production-sized dataset. The seed command:
php artisan db:seed --class=ProductionSizeSeeder
# 380 projects, 14,000 tasks, 120 users, 4,200 comments
Two additional tools ran alongside Debugbar:
// In AppServiceProvider::boot() — logs every query with its caller
DB::listen(function ($query) {
    if (config('app.debug')) {
        Log::channel('queries')->info($query->sql, [
            'bindings' => $query->bindings,
            'time'     => $query->time,
            'caller'   => $this->getQueryCaller(),
        ]);
    }
});

private function getQueryCaller(): string
{
    $trace = debug_backtrace(DEBUG_BACKTRACE_IGNORE_ARGS, 20);
    foreach ($trace as $frame) {
        if (isset($frame['file']) && str_contains($frame['file'], '/app/')) {
            return "{$frame['file']}:{$frame['line']}";
        }
    }
    return 'unknown';
}
The query log with callers was the most useful artifact. It showed exactly which file and line number triggered each query. Without this, 847 queries is a number. With it, it’s a map.
// Telescope in local — alternative to custom logging
php artisan telescope:install
php artisan migrate
Telescope’s query tab groups identical queries and shows which request triggered them. For the 847 queries, Telescope revealed that 412 of them were identical: SELECT * FROM users WHERE id = ? with different ID bindings. One query per user, 412 times.
The First Pass: Tracing the Controller
The controller was the starting point. The dashboard controller loaded projects with a paginator:
// BEFORE — the controller that started 847 queries
public function index(): View
{
    $projects = Project::where('tenant_id', auth()->user()->tenant_id)
        ->orderBy('updated_at', 'desc')
        ->paginate(20);

    return view('dashboard.index', compact('projects'));
}
Innocent looking. The problem was entirely in the view.
The N+1 Audit: The View Was the Crime Scene
The Blade view iterated over projects. For each project, it accessed relationships. Every relationship access without eager loading triggered a query. The view traversal:
{{-- BEFORE — every line here is a query per project --}}
@foreach ($projects as $project)
    <div class="project-card">
        {{-- Query 1: SELECT * FROM users WHERE id = project.owner_id --}}
        <span>{{ $project->owner->name }}</span>

        {{-- Query 2: SELECT * FROM tasks WHERE project_id = ? ORDER BY created_at DESC LIMIT 5 --}}
        @foreach ($project->tasks()->latest()->limit(5)->get() as $task)

            {{-- Query 3 per task: SELECT * FROM users WHERE id = task.assigned_to --}}
            <span>{{ $task->assignee->name }}</span>

            {{-- Query 4 per task: SELECT COUNT(*) FROM comments WHERE task_id = ? --}}
            <span>{{ $task->comments()->count() }}</span>

        @endforeach

        {{-- Query 5: SELECT COUNT(*) FROM tasks WHERE project_id = ? --}}
        <span>{{ $project->tasks()->count() }} tasks</span>

        {{-- Query 6: SELECT COUNT(*) FROM tasks WHERE project_id = ? AND status = 'completed' --}}
        <span>{{ $project->tasks()->where('status', 'completed')->count() }} done</span>

        {{-- Query 7: SELECT * FROM tags WHERE... (many-to-many pivot) --}}
        @foreach ($project->tags as $tag)
            <span class="tag">{{ $tag->name }}</span>
        @endforeach
    </div>
@endforeach
20 projects on the paginator. Per project: 1 (owner) + 5×2 (task assignee + comment count) + 1 (task count) + 1 (completed count) + 1 (tags) = 14 queries. 20 × 14 = 280 baseline queries. But each of those 5 tasks also triggered its own sub-queries through the method calls on the relationship, pulling in additional data. The 847 number came from the compound effect.
The query log confirmed the pattern:
[Query] SELECT * FROM users WHERE id = 12        ← app/View/Components/ProjectCard.php:23
[Query] SELECT * FROM users WHERE id = 12        ← app/View/Components/ProjectCard.php:23
[Query] SELECT * FROM users WHERE id = 12        ← app/View/Components/ProjectCard.php:23

[repeated 38 more times — same user, same query, 40 total for 20 projects]
User 12 was the owner of 40 projects. The same row fetched 40 times. No caching, no deduplication.
Fix 1: Eager Loading — The Biggest Single Win
The first fix moved all relationship loading to the controller query. One query per relationship instead of one per record:
// AFTER — eager load everything the view touches
public function index(): View
{
    $projects = Project::where('tenant_id', auth()->user()->tenant_id)
        ->with([
            'owner:id,name,avatar_url',       // ✅ only the columns the view needs
            'tags:id,name,color',             // ✅ pivot loaded with tags
            'tasks' => function ($query) {
                $query->latest()
                      ->limit(5)
                      ->with('assignee:id,name,avatar_url')
                      ->withCount('comments');
                // ✅ withCount adds comment_count attribute — no per-task query
            },
        ])
        ->withCount([
            'tasks',                                   // ✅ adds tasks_count
            'tasks as completed_tasks_count' => fn ($q) => $q->where('status', 'completed'),
        ])
        ->orderBy('updated_at', 'desc')
        ->paginate(20);

    return view('dashboard.index', compact('projects'));
}
Query count after Fix 1: 7 queries. Not 11 yet — that came after fixing the view’s method calls.
The owner:id,name,avatar_url syntax is column-scoped eager loading. It only selects the three columns the view actually uses, not the full users row including password hash, remember tokens, and every other field.
withCount('comments') adds a comment_count attribute to each task. The view accesses $task->comment_count (attribute access, zero queries) instead of $task->comments()->count() (method call, one query per task).
The Blade view updated to use the preloaded data:
{{-- AFTER — all data already loaded, zero queries in the view --}}
@foreach ($projects as $project)
    <div class="project-card">
        {{-- ✅ attribute access — no query --}}
        <span>{{ $project->owner->name }}</span>

        @foreach ($project->tasks as $task)
            {{-- ✅ already eager loaded --}}
            <span>{{ $task->assignee->name }}</span>

            {{-- ✅ withCount attribute — no query --}}
            <span>{{ $task->comment_count }}</span>
        @endforeach

        {{-- ✅ withCount — no query --}}
        <span>{{ $project->tasks_count }} tasks</span>
        <span>{{ $project->completed_tasks_count }} done</span>

        @foreach ($project->tags as $tag)
            {{-- ✅ already eager loaded --}}
            <span class="tag">{{ $tag->name }}</span>
        @endforeach
    </div>
@endforeach
The Remaining Queries After Fix 1
After eager loading, the query log showed 7 queries for the page load:
1.  SELECT COUNT(*) FROM projects WHERE tenant_id = ?
    [pagination count query — unavoidable]

2.  SELECT projects.*, COUNT(tasks) as tasks_count, COUNT(completed) as completed_tasks_count
    FROM projects WHERE tenant_id = ? ORDER BY updated_at DESC LIMIT 20 OFFSET 0
    [main paginated query with withCount]

3.  SELECT id, name, avatar_url FROM users WHERE id IN (12, 34, 56, ...)
    [owner eager load — one query for all 20 owners]

4.  SELECT tags.*, project_tag.project_id FROM tags
    INNER JOIN project_tag ON tags.id = project_tag.tag_id
    WHERE project_tag.project_id IN (1, 2, 3, ...)
    [tags eager load with pivot — one query for all 20 projects]

5.  SELECT tasks.* FROM tasks WHERE project_id IN (1, 2, 3, ...)
    ORDER BY created_at DESC
    [tasks eager load — one query for all projects' tasks]

6.  SELECT id, name, avatar_url FROM users WHERE id IN (7, 23, 41, ...)
    [task assignee eager load — one query for all task assignees]

7.  SELECT task_id, COUNT(*) as aggregate FROM comments
    WHERE task_id IN (101, 102, ...) GROUP BY task_id
    [withCount for comments — one query for all tasks]
7 queries. Down from 847. The page loaded in 320ms on the production dataset.
Not 11 yet. The additional 4 queries came from other parts of the page layout that weren’t in the main content area.
Fix 2: The Layout Queries Nobody Was Watching
The query log showed 4 more queries firing on every page load, not just this page:
8.  SELECT * FROM users WHERE id = 1         ← app/Http/Middleware/LoadUserPreferences.php:34
9.  SELECT * FROM notifications WHERE user_id = 1 AND read_at IS NULL
    ← app/View/Components/NotificationBell.php:18
10. SELECT * FROM tenant_settings WHERE tenant_id = 3
    ← app/Providers/TenantServiceProvider.php:67
11. SELECT * FROM feature_flags WHERE tenant_id = 3
    ← app/Providers/TenantServiceProvider.php:89
Queries 8–11 fired on every page in the application, not just the dashboard. They were structural queries, not page-specific ones.
Query 8 — Redundant user load in middleware:
// BEFORE — LoadUserPreferences middleware re-fetched the authenticated user
class LoadUserPreferences
{
    public function handle(Request $request, Closure $next): Response
    {
        // auth()->user() already loaded the user — this loads it again
        $user = User::find(auth()->id());
        View::share('preferences', $user->preferences);
        return $next($request);
    }
}

// AFTER — use the already-authenticated user
class LoadUserPreferences
{
    public function handle(Request $request, Closure $next): Response
    {
        View::share('preferences', auth()->user()->preferences);
        return $next($request);
    }
}
User::find(auth()->id()) fetched the user from the database. auth()->user() returned the user already loaded into the auth guard — no database hit. One extra query, every page load, for two years.
Queries 9 — Notification count, called from a View Component:
// BEFORE — live count on every render
class NotificationBell extends Component
{
    public function render(): View
    {
        return view('components.notification-bell', [
            'count' => auth()->user()
                ->notifications()
                ->whereNull('read_at')
                ->count(),
        ]);
    }
}

// AFTER — read from the user model's cached count
// The user model stores unread_notifications_count and updates it
// when notifications are created/read, via model observers
class NotificationBell extends Component
{
    public function render(): View
    {
        return view('components.notification-bell', [
            'count' => auth()->user()->unread_notifications_count,
        ]);
    }
}
The unread_notifications_count column on the users table is updated by an observer whenever a notification is marked read or a new one arrives. The view component reads a column, not a count query. Zero queries.
// The observer that keeps the count current
class NotificationObserver
{
    public function created(Notification $notification): void
    {
        User::where('id', $notification->user_id)
            ->increment('unread_notifications_count');
    }

    public function updated(Notification $notification): void
    {
        if ($notification->wasChanged('read_at') && $notification->read_at !== null) {
            User::where('id', $notification->user_id)
                ->decrement('unread_notifications_count');
        }
    }
}
Denormalizing the count into the users table trades a read query for a write update. The write happens when notifications change (infrequent). The read happens on every page load (frequent). This is the correct trade.
Queries 10 and 11 — Tenant settings and feature flags loaded on every request:
// BEFORE — database queries in the service provider on every request
class TenantServiceProvider extends ServiceProvider
{
    public function boot(): void
    {
        $tenant = Tenant::find(auth()->user()?->tenant_id);
        if ($tenant) {
            View::share('tenantSettings', TenantSettings::where('tenant_id', $tenant->id)->first());
            View::share('featureFlags', FeatureFlag::where('tenant_id', $tenant->id)->get());
        }
    }
}

// AFTER — cached, cleared on update
class TenantServiceProvider extends ServiceProvider
{
    public function boot(): void
    {
        $this->app->booted(function () {
            if (auth()->check()) {
                $tenantId = auth()->user()->tenant_id;

                $settings = Cache::remember(
                    "tenant:{$tenantId}:settings",
                    now()->addMinutes(60),
                    fn () => TenantSettings::where('tenant_id', $tenantId)->first()
                );

                $flags = Cache::remember(
                    "tenant:{$tenantId}:features",
                    now()->addMinutes(60),
                    fn () => FeatureFlag::where('tenant_id', $tenantId)->get()
                );

                View::share('tenantSettings', $settings);
                View::share('featureFlags', $flags);
            }
        });
    }
}
The cache is cleared in a model observer on TenantSettings and FeatureFlag:
static::saved(fn ($model) => Cache::forget("tenant:{$model->tenant_id}:settings"));
Tenant settings almost never change. Fetching them from the database on every request was pure overhead. Caching them for 60 minutes eliminated 2 queries per page load across the entire application, not just the dashboard.
The Final Query Count and Timings
BEFORE                        AFTER
─────────────────────────     ─────────────────────────
Total queries:   847           Total queries:   11
Query time:      2,847ms       Query time:      89ms
Total page:      3,200ms       Total page:      140ms
Memory:          148MB          Memory:          34MB
The 11 queries that remain:
 1. Authenticate the user (session/token lookup)
 2. Load tenant settings from cache hit (actually 0 DB, but counted as a lookup)
 3. Pagination count for projects
 4. Main projects query with withCount
 5. Project owners eager load
 6. Project tags eager load (with pivot)
 7. Tasks eager load for all projects
 8. Task assignees eager load
 9. Comment counts for tasks (withCount)
10. Notification count (now a column read, 0 queries — but audit counted the user load)
11. Feature flags from cache
Query 2 and 11 are cache hits — Redis reads, not database queries. The actual database query count is 9. The audit counted 11 because the tooling included cache operations.
The Tools That Made This Possible
Tool                    What it revealed
──────────────────────────────────────────────────────────
Laravel Debugbar        Total query count, per-query timing, stack traces
DB::listen() + log      Exact file and line number of every query caller
Laravel Telescope       Grouped identical queries, request correlation
Model::preventLazyLoading()  Threw exceptions for every N+1 during development
EXPLAIN in MySQL Workbench   Index usage on the 4 remaining slow queries
Model::preventLazyLoading() was added after the fix, not before. It would have helped during the feature build. It now lives in AppServiceProvider::boot() behind the isLocal() check — any new N+1 introduced during development throws an exception before it reaches staging.
The Pattern, Not Just the Numbers
The 847-to-11 number is specific to this page and this codebase. The pattern is universal:
Step 1: Measure before touching anything
        → Debugbar + DB::listen() + production-sized seed data

Step 2: Find the N+1s — they're almost always the majority
        → Telescope's grouped queries reveal identical SQL with different bindings
        → The query caller tells you which view file to fix

Step 3: Eager load relationships with column selection
        → with('relation:id,name') not with('relation')
        → withCount() for counts, not ->count() in the view

Step 4: Replace method calls in views with attribute access
        → $project->tasks()->count()  →  $project->tasks_count
        → $task->comments()->count()  →  $task->comment_count

Step 5: Audit the layout, not just the page content
        → Middleware queries that fire on every request
        → View components that run their own queries
        → Service providers that hit the database during boot

Step 6: Cache structural data that rarely changes
        → Tenant settings, feature flags, user preferences
        → Denormalize counts into parent models when counts are read-heavy

Step 7: Lock in the gains with preventLazyLoading()
        → Any future N+1 throws in development before it reaches production
The memory improvement — 148MB to 34MB — came directly from column-scoped eager loading. with('owner') loaded the entire users row for every owner. with('owner:id,name,avatar_url') loaded three columns. At 20 projects per page, that’s the difference between 20 full user hydrations and 20 partial ones.
The 140ms page load time includes the full Laravel boot cycle, authentication, and rendering. The queries themselves took 89ms. On a production server with a local MySQL instance rather than a network-connected database, both numbers improve further.
The Code Review Silence
The PR went up with a description: “Query optimization pass on the dashboard page. 847 → 11 queries, 3.2s → 140ms.” The first comment was from the team lead: “How?”
The answer was the query log. Not a profiler output that required interpretation. The actual SQL queries, with the file names and line numbers that generated them, lined up in a log file. Every fix in the PR traced back to a line in that log.
The team added DB::listen() to the base project template after the review. It now runs in every local environment. The dashboard has stayed at 11 queries for four months.